Following on from our Financial Outlook in May I thought I would share with you some interesting market data.
Firstly, the ANZ Truckometer. This economic indicator is derived using traffic volume data from around the country. Traffic flows are a real time and real-world proxy for economic activity – particularly for the New Zealand economy, where a large proportion of freight is moved by road. It represents an extremely timely barometer of economic momentum.
As you can see from the latest graph on the left, the volumes are continuing to grow and GDP continues to follow.
The second is the date surrounding the vacancy for Auckland commercial property market.
Currently we are sitting at an all-time low. The map below shows the current vacancy as per a presentation from Bayley’s in August.
The low vacancy has a couple of implications:
- The economy is tracking nicely if the growth has meant such high utilization of the industrial buildings
- Growth will be restricted if it is limited, in this case industrial building stock
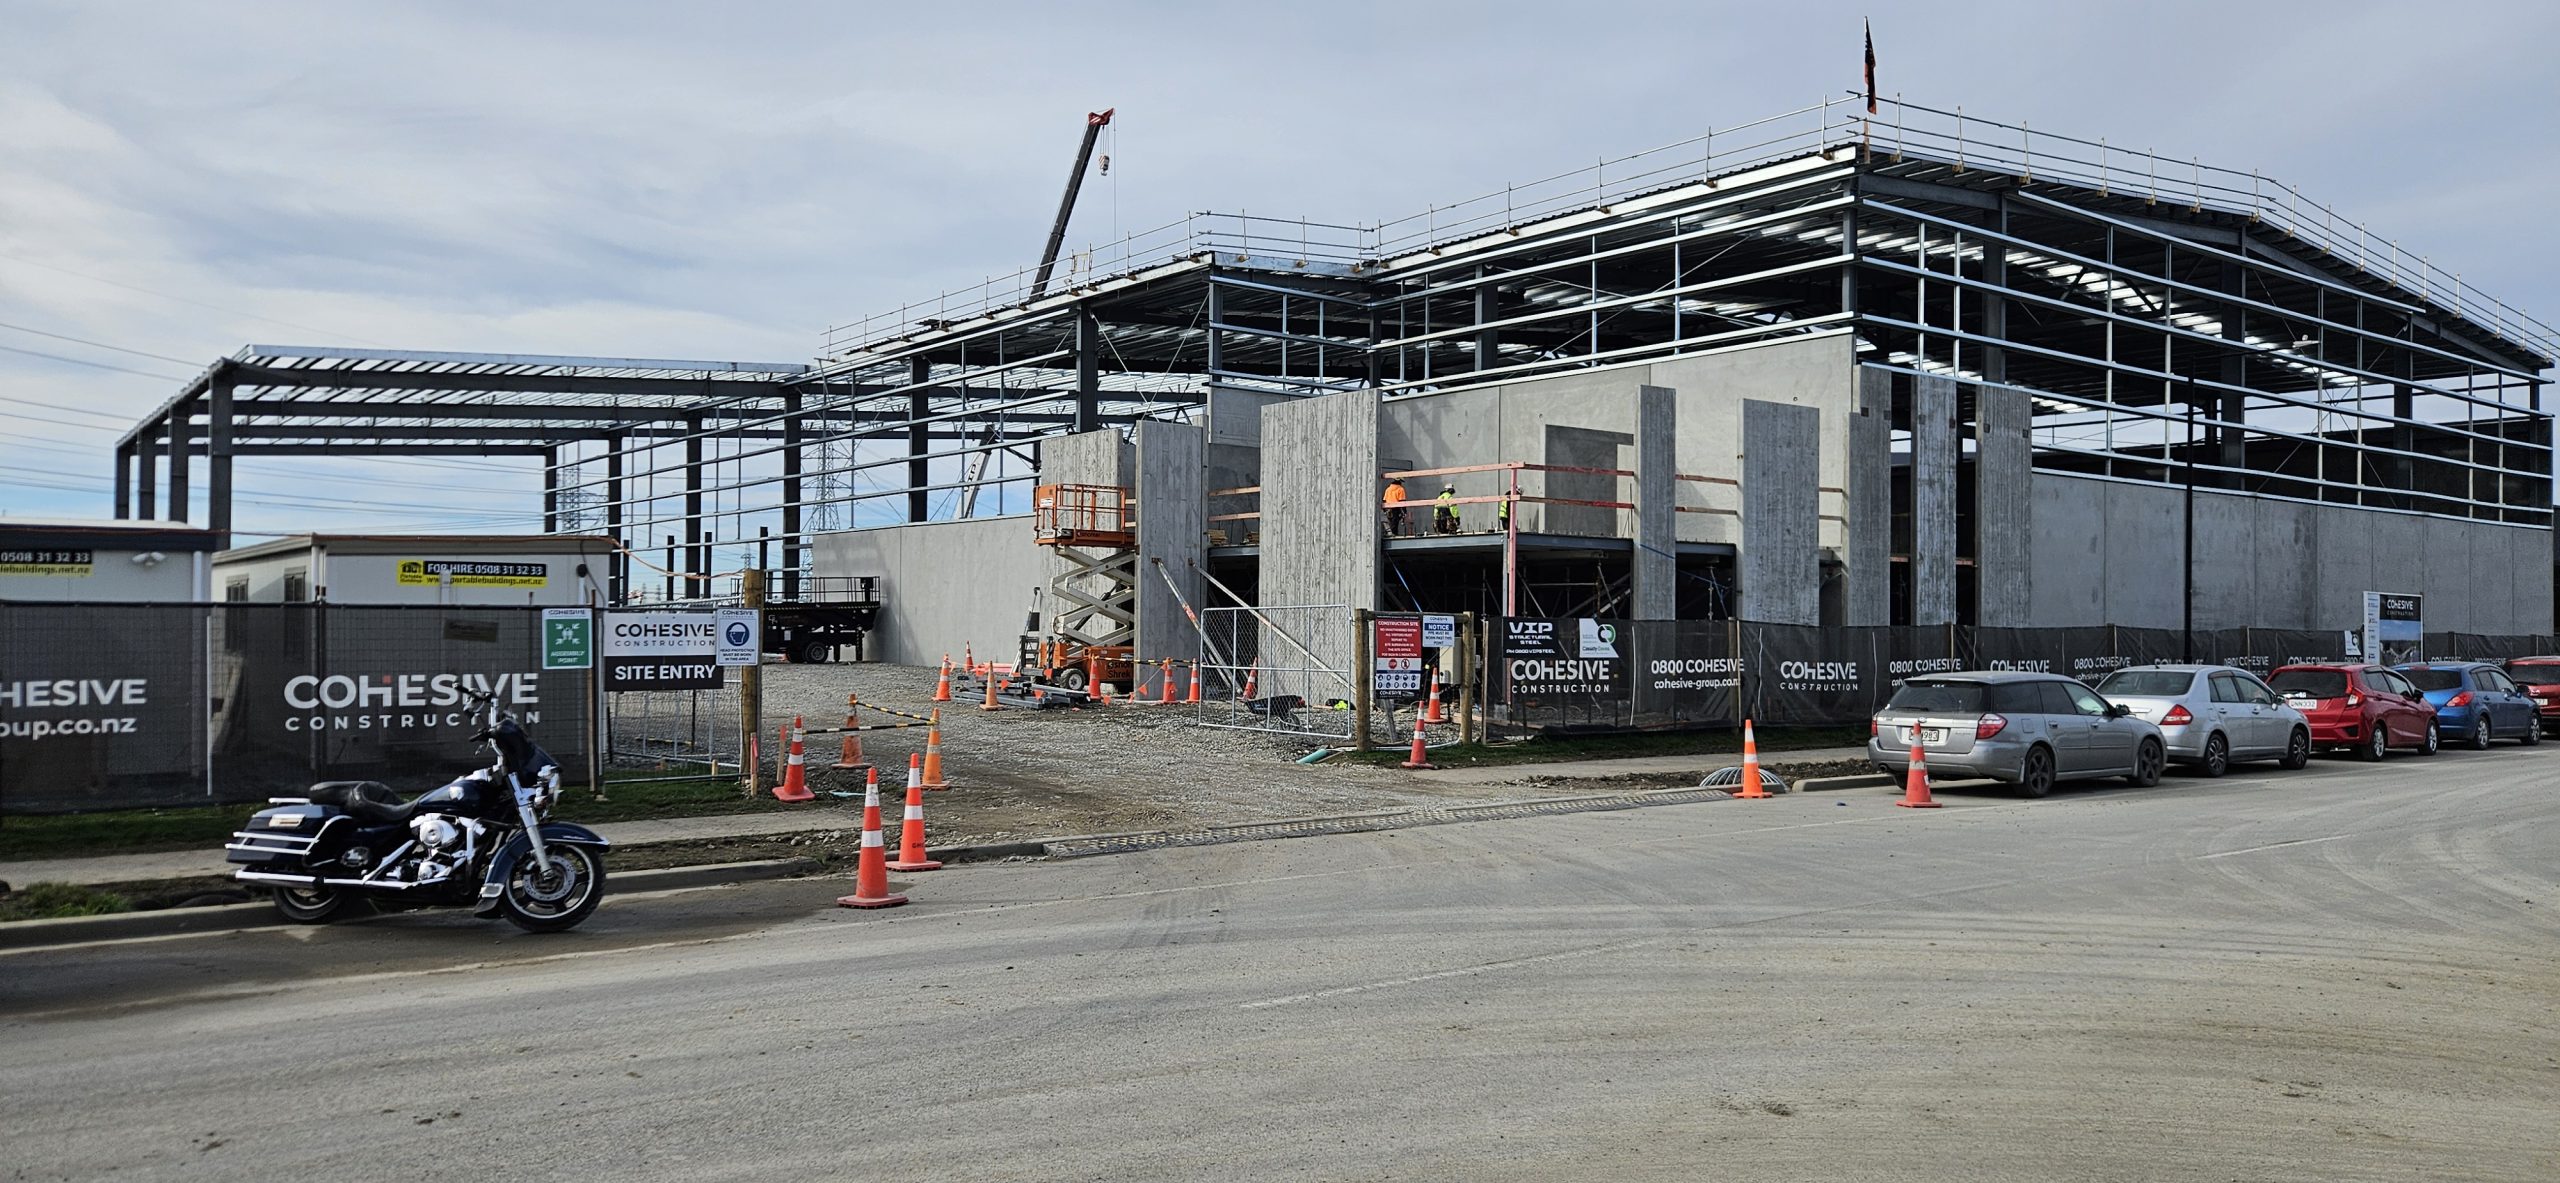
- Construction is responding but not quickly enough to meet demands. This low supply vs high demand position will mean landlords will be able to drive rents higher which will increase yields which are at an all-time low
- Unfortunately the low vacancy rates leading to higher rents will drive cost into your supply chain through higher storage costs.
In summary the truck movements and low vacancy rates point to the fact the economy is still looking healthy. There is however a note in there about potential rental increases, which on the back of minimum wage increases that are pending, should indicate to businesses to be cautiously optimistic.
Cheers
Phil Walsh
CFO


